


How to Use First Principles Thinking to Super-Charge Innovation in Design

In my last article, I criticized the whole profession of UX Design for not being innovative enough. So, I owe to describe a better way of how to create innovation. Here it is…
To understand how to innovate as a designer and use a medium to supercharge human capabilities let’s look at the original medium: Paper.
How to Innovate with Paper
The invention of the printing press changed our relationship to text and ideas by creating a sense of uniformity, while encouraging generic production and wide distribution.

Making content on paper affordable and widely available enabled for humans the superpowers to...
Retain information over time
Present information in visual form to enhance human thinking and problem solving
But it took a while until people used this potential properly.
In 1786, William Playfair, a Scottish engineer and political economist, wrote his book “Commercial and Political Atlas” for which he had a lot of data. Back then, data was always presented as tables with a lot of numbers.
Playfair realized, that there is a certain form of understanding that we bring to tables and numbers, but there is a different kind of understanding that we bring to maps. There are other helpful perceptual and cognitive abilities that we bring to understanding spatial relationships.
So, Playfair made a very peculiar kind of map. And that was the first data chart.

This is obviously a powerful way of understanding data. But it took around 100 years until it was broadly used. Today, data plots are fundamental to all science and engineering.
Playfair realized that certain cognitive capabilities of humans to understand data were not used in the old way of representing the data. So, he found a new way.
That’s how representations can work their magic. They work on some latent human capabilities, developed in some hunter-gatherer context, and they bring them to the surface, so that they can be used in a more abstract context.
So how do we create innovation as designers?
You need a deep understanding of two things:
Human psychology and the latent capabilities of the human mind
The medium you are designing for (the capabilities of the medium and what makes the medium special)
Let’s start with humans.
The latent capabilities of human beings
What are the human capabilities of the human mind – our modes of understanding?
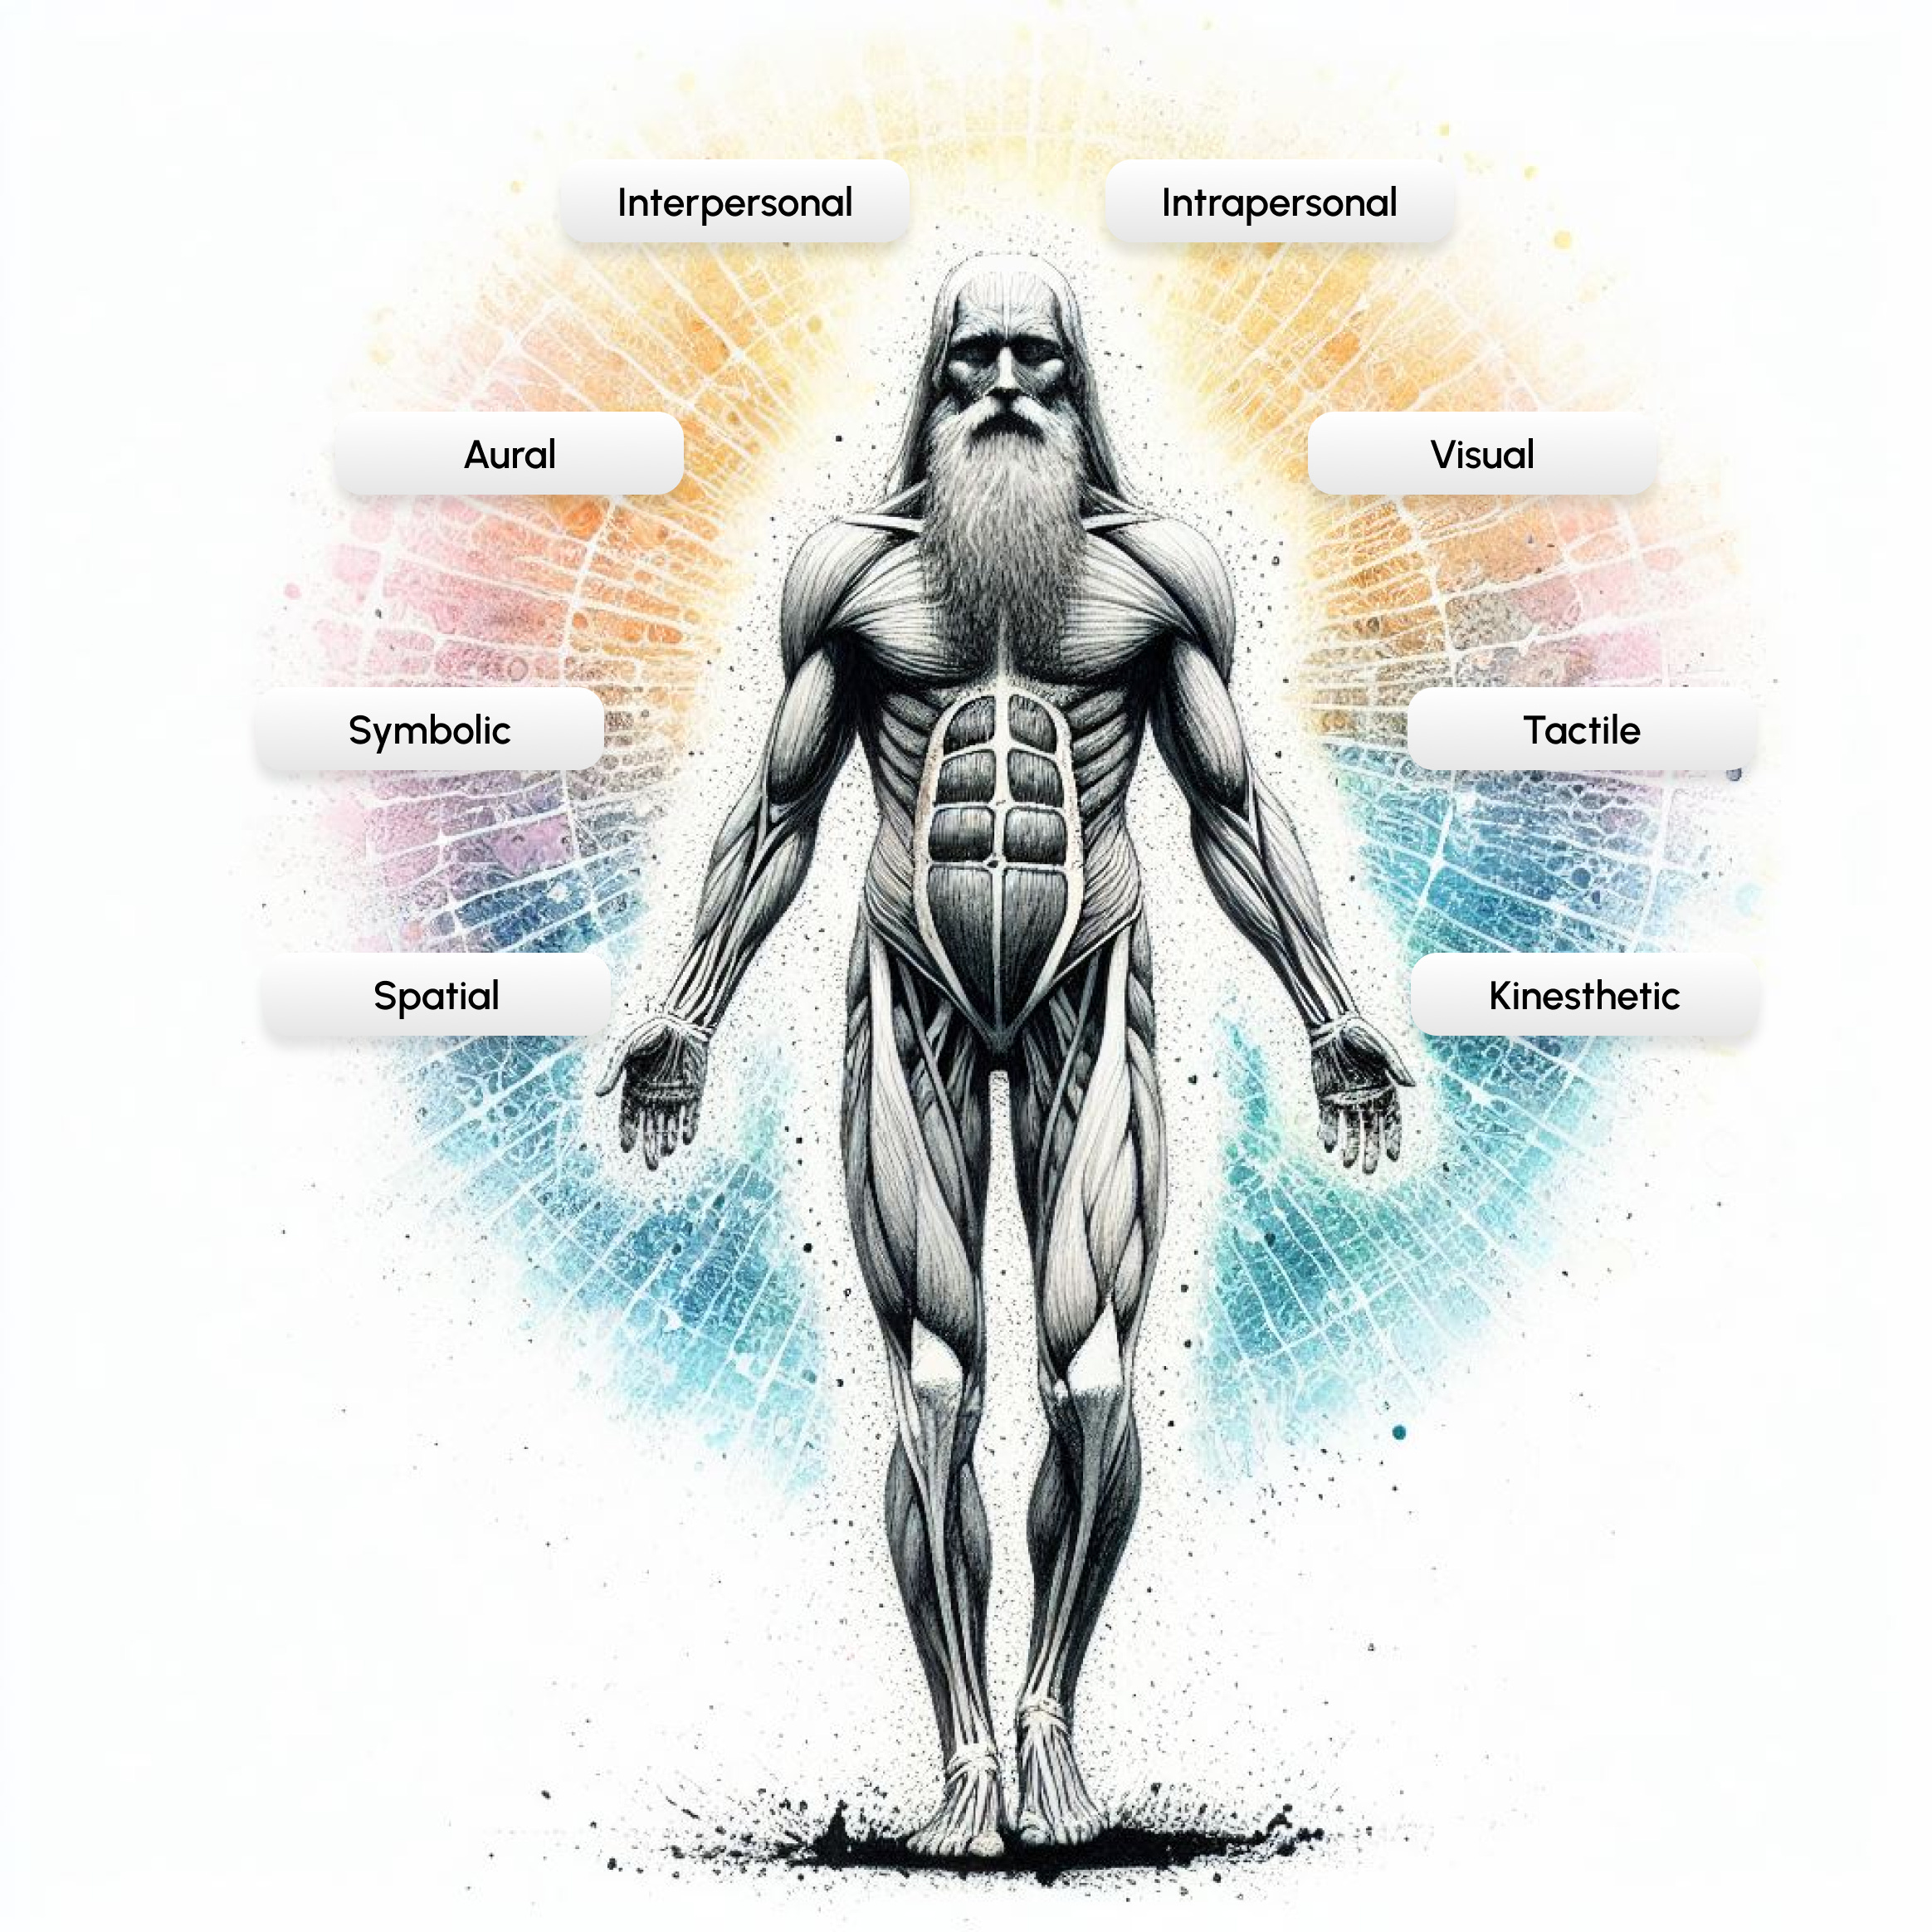
There are several theories in the scientific literature to classify human thinking modes2,3,4. For our needs as designers, I would classify them as follows:
Symbolic: Relates to the use of symbols and abstract signs to represent ideas or concepts. It's crucial in areas like mathematics, written language, and various forms of symbolic logic.
Visual: Involves understanding through seeing. It includes the ability to interpret, remember, and analyze visual information in the environment or from graphics and images.
Aural: Pertains to understanding through listening. It encompasses skills in recognizing and interpreting sounds and auditory patterns, including spoken language and music.
Spatial: Concerns the ability to perceive and manipulate the spatial relationships among objects. This mode is key in navigating environments, understanding maps, and visualizing objects from different angles.
Interpersonal: Involves understanding other people's feelings, motives, and intentions. It plays a significant role in communication, empathy, and social interaction.
Intrapersonal: Relates to self-awareness and the ability to understand one's own emotions, motivations, and inner states of being.
Tactile: Pertains to understanding through touch. It involves perceiving and manipulating the environment through physical contact, which is essential in tasks requiring fine motor skills.
Kinesthetic: Involves understanding through body movements and physical sensation. It's critical in activities that require coordination, balance, and the manipulation of objects.
We currently mostly focus on the first three modes when designing computer interfaces. This leaves a lot of potential on the table.
A not-so-new medium: The Computer
You don’t have to use emergent tech like Augmented Reality to create innovation. Although 90 years old, we are still mostly using computers as glorified paper simulators, leaving most of its capabilities bare.
Let's apply first-principles thinking to deconstruct this medium. What unique capabilities do computers enable that are not available in other media?
I see mainly three:
Interactivity: Computers can depict powerful versatile representations that allow users not only to see but to explore systems.
Simulations: The immense computational power accessible to us allows us to create elaborate simulations of systems that enable users to “look into the future” or “explore parallel realities.“
Connectivity: By connecting computers with sensors or with each other, we can gather and share vast amounts of information from a potentially global network.
Let’s explore these three superpowers in more detail.
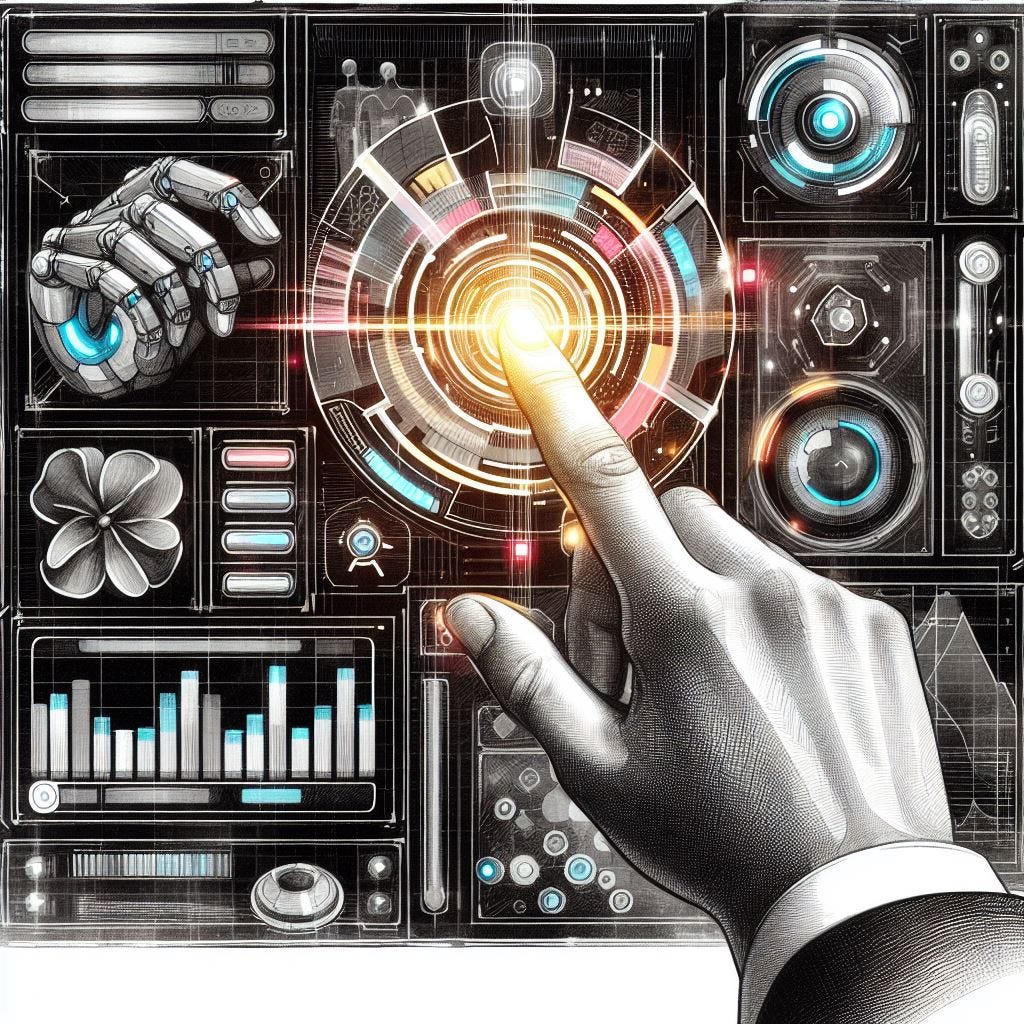
Interactivity
The computer is the first meta-medium. It can dynamically simulate the details of any other medium. It allows for degrees of freedom for representation and expression never before encountered and as yet barely investigated. We have virtually no limits on how we can manipulate information.
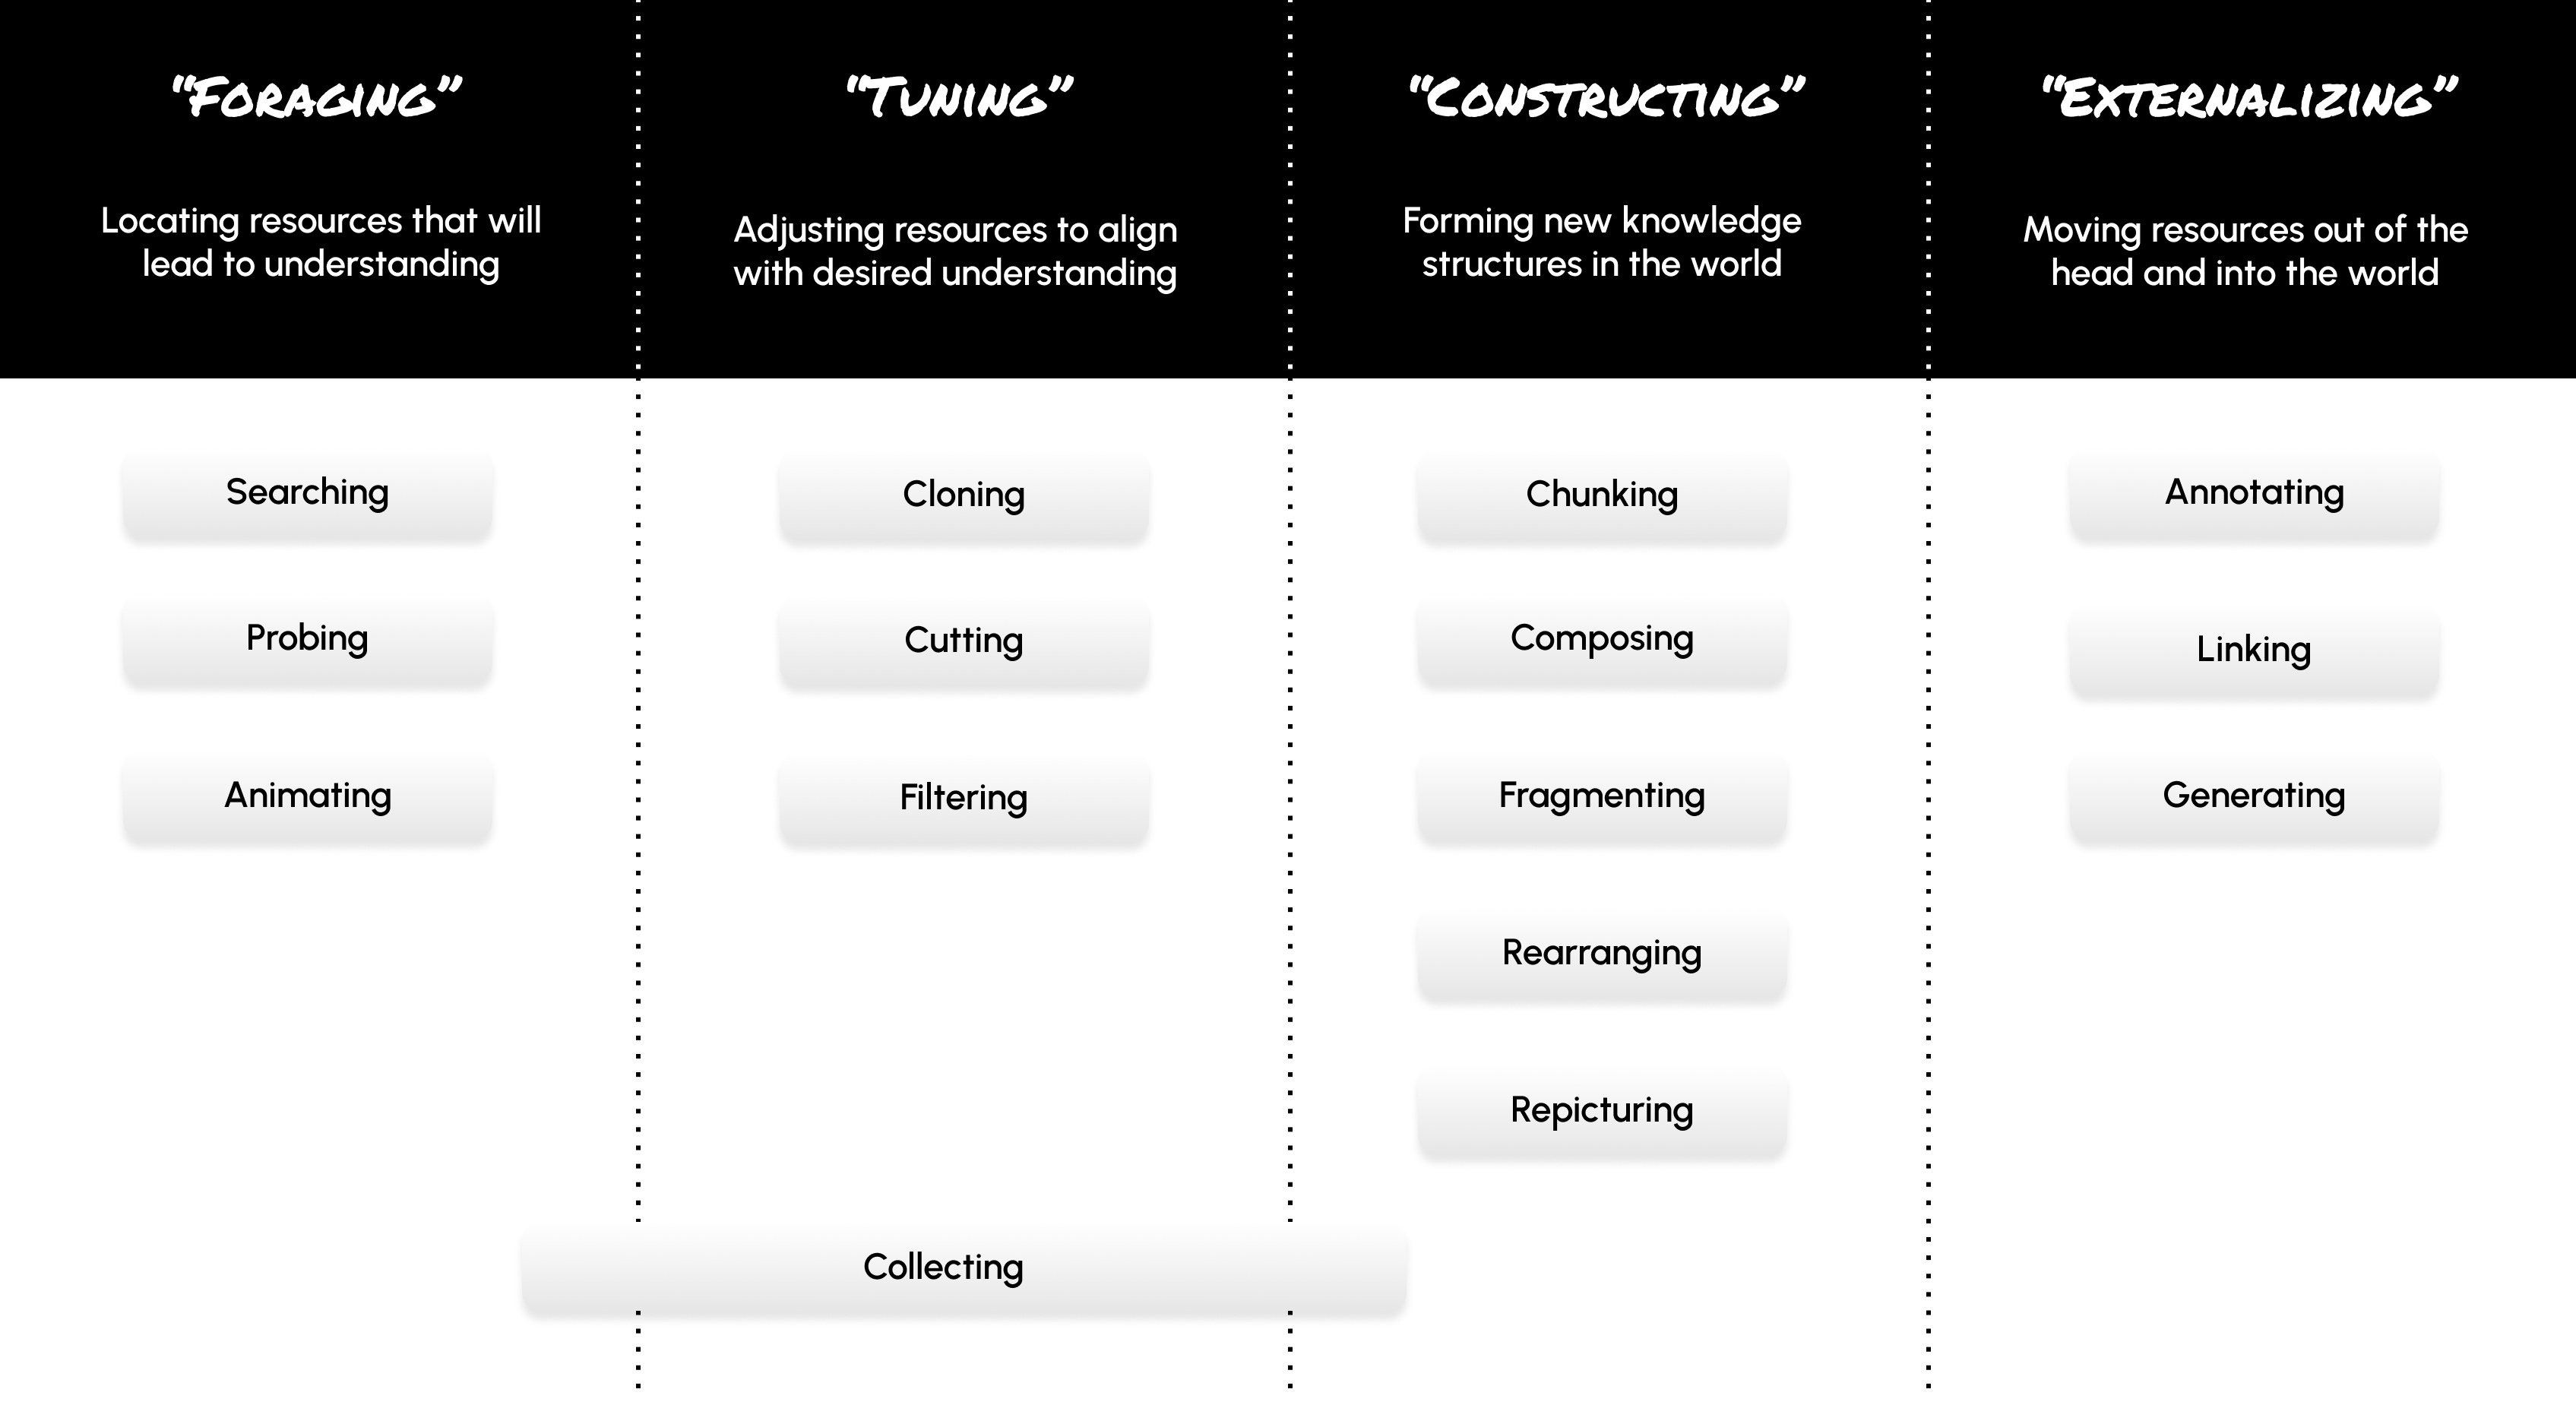
This gives us another opportunity to think in a “First Principle Way”: What do humans want to do with information? Luckily, Stephen P. Anderson and Karl Fast have already thought about that in their book “Figure It Out: Getting From Information to Understanding”5. They cluster all the various “information tasks” into four “interaction themes“:
Foraging: Locating resources that will lead to understanding.
Tuning: Adjusting resources to align with desired understanding.
Externalizing: Moving resources out of the head and into the world.
Constructing: Forming new knowledge structures in the world.
Despite this potential for interactivity, the most common model on the web is still the “Newspaper” or “Billboard” model. Static content is presented for reading.
Yet interactive representations allow for so much more. What if the content was responsive and dynamic? This is the question Bret Victor asked himself to come up with a better alternative on how to write a scientific paper describing an algorithm:
„When an algorithm is described in prose (or code), we are typically given only the rules of the system — we can't see the data or the state. In order to understand what the algorithm is doing, we have to "play computer" and imagine the state in our head. Illustrating the state of an algorithm at each step can make the description dramatically easier to follow.
I've used a small amount of lightweight interactivity (via hover-sliders ) to allow the reader to see the progression of the algorithm, in-place, over many steps. This interaction is optional and supplemental — it's available for a reader who wants the clarification, but can be skipped by a reader who already understands (or doesn't care). …
The roles of pictures and prose can be fluid. For the description of the algorithm, pictures are coupled to individual sentences or even fragments, and the words serve to explain the action in the pictures.
Since this is a static blog post, it is essential to visit Bret Victor’s article6 to grasp this point fully and experience the “interactivity”:
Bret Victor, beast of burden (worrydream.com)
Simulations (Computational Foresight)
The advent of powerful computational capabilities gave us a superpower that transcends the traditional bounds of time and space: the power of simulation. We now can construct intricate models of systems and project their behavior into the future or explore the myriad possibilities that lie in alternate scenarios.
Through simulations, we can predict weather patterns, model the intricacies of global economies, or even delve into the quantum realms. It enables us to foresee outcomes, test hypotheses in silico, and make informed decisions that were once relegated to the realm of speculation.
In the realm of simulations, the ability to preserve and expose past states of a system is invaluable. This feature allows users to not only observe the system's current state but also to navigate through its historical states. By maintaining a record of past states, simulations offer a comprehensive timeline of events and decisions, enabling users to analyze how the system evolved to its present configuration. This temporal journey through past states facilitates the identification of pivotal moments, offering insights into the cause-and-effect relationships within the system.
It also enhances the decision-making process by providing a robust framework for comparative analysis, where current strategies can be weighed against historical outcomes, thus fostering a deeper understanding of the system's dynamics and informing future strategies.
The crowd simulation company uCrowds has a really cool example that shows how simulations can be improved by leveraging the interactivity of the computational medium. Their dynamic simulation updates in real-time when the environment is changed by the user.
Unlocking unlimited possibilities by simulating the human mind
The most powerful instantiation of this computational prowess is realized by combining Machine Learning with Big Data:
At their core, LLMs simulate the vast and complex network of human linguistic interactions by digesting and processing enormous datasets composed of text from a myriad of sources. This simulation goes beyond mere mimicry of syntactic structures; it extends to understanding context, generating coherent and contextually relevant responses, and even exhibiting a form of 'creativity' in producing novel content.
We don’t seem far away of AGI, which refers to a type of artificial intelligence that possesses the ability to understand, learn, and apply knowledge across a wide range of tasks and domains, much like an average human. From there it’s probably only a small step to ASI – Artificial Super-Intelligence, that outperforms every human on every task.
Connectivity
Via networks and sensors, the digital medium can pull and exchange information from and between a wide variety of sources. In the case of sensor data, translating what’s sensed into manipulable representations can help us understand aspects of the world around us that we can’t directly observe.
So, in the digital medium we can:
Involve sensor data that might not be available to human cognition
Connect to distant sources of information
Connect distant people
Quickly and easily share information across the world
Quickly and easily transmit or broadcast information at scale
If you combine the superpowers of sensor connectivity and simulation, you can realize especially powerful tools: Digital Twins.
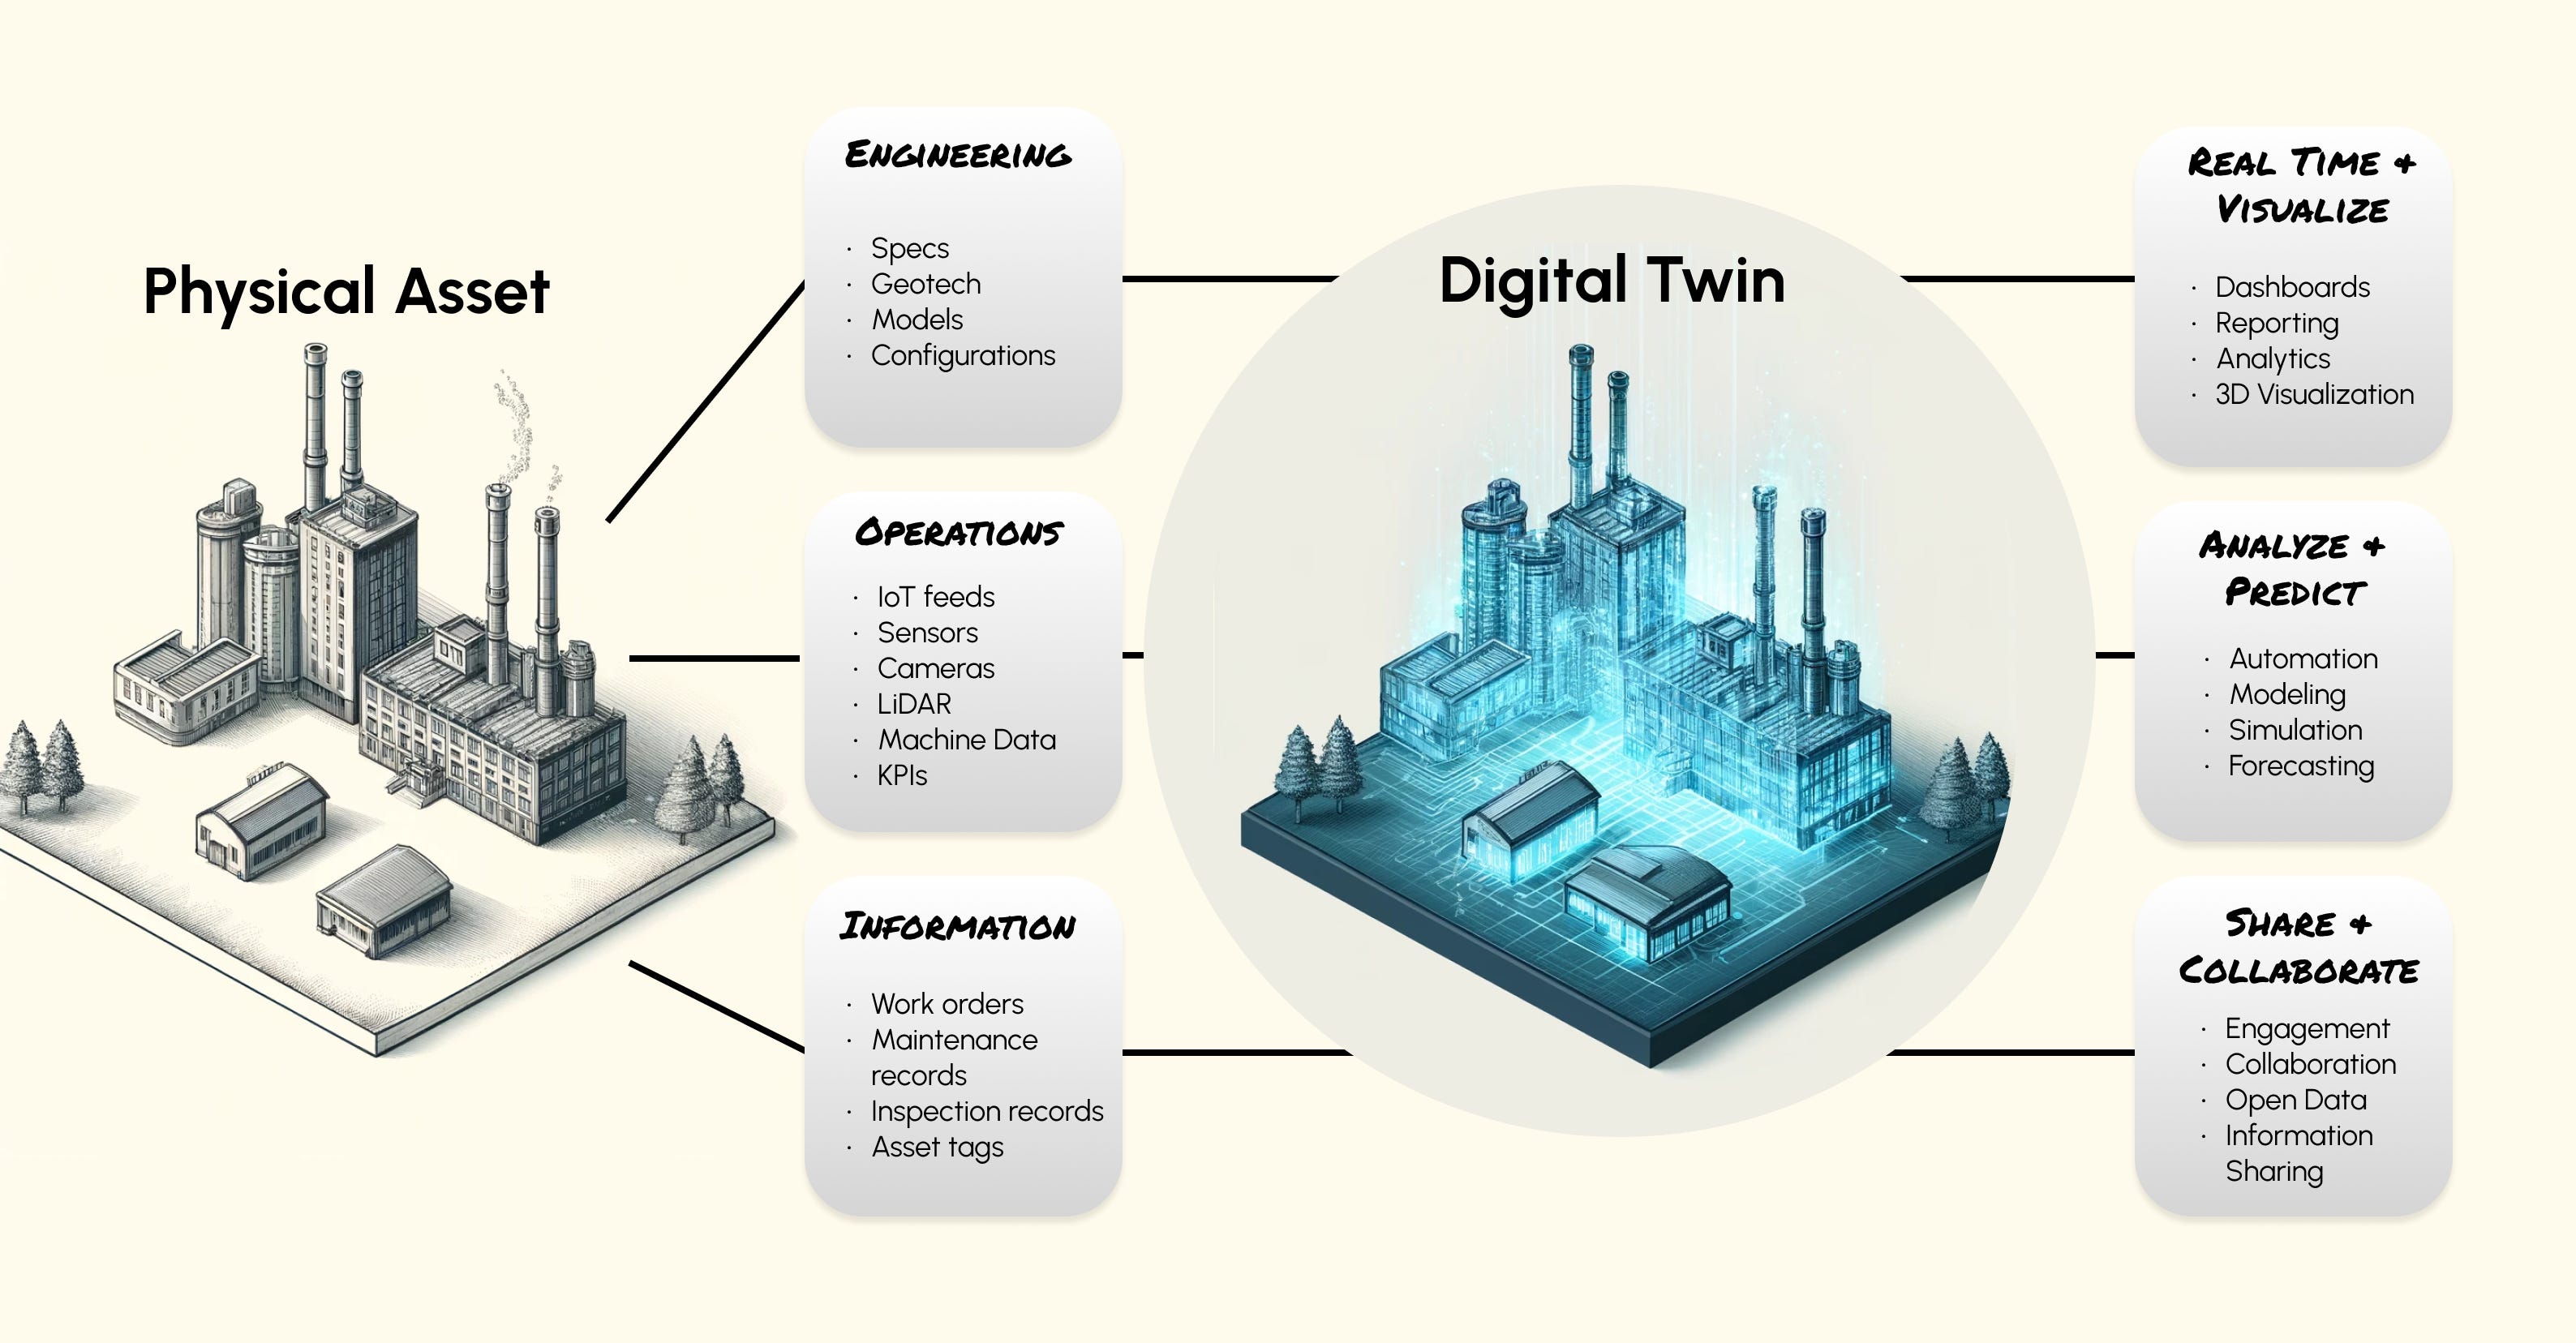
For example, factory digital twins enable useful use cases:
Sensors that measure material stock flow, combined with process digitization and simulations that project when stock will run out allow for automatic stock replenishment.
Visualizing all assets, projects, business units and employees allows management to see how all these entities perform against their business goals. Through simulations, predictive analytics can be performed, and recommendations given on how to improve the system.
We saw during COVID-19 the effects of a supply chain going wrong. A data network that spans the globe could perform supply chain analytics to mitigate bottlenecks in global trade.
Smart machines equipped with sensors could demonstrate a form of “self-awareness” about their state of maintenance. This enables fix-before-failure, and they could integrate and collaborate with one another across domains.
All these use cases can be optimized by making the simulation really interactive by letting the user seamlessly adjust every parameter and dynamically show the effects on the simulation in real-time.
How to use “First Principle Thinking” to innovate in practice
In the following, I’ll describe an example brainstorming to showcase how you can use “First Principle Thinking” in your problem domain.
First, define a problem statement to allow for broad exploration of ideas. For example:
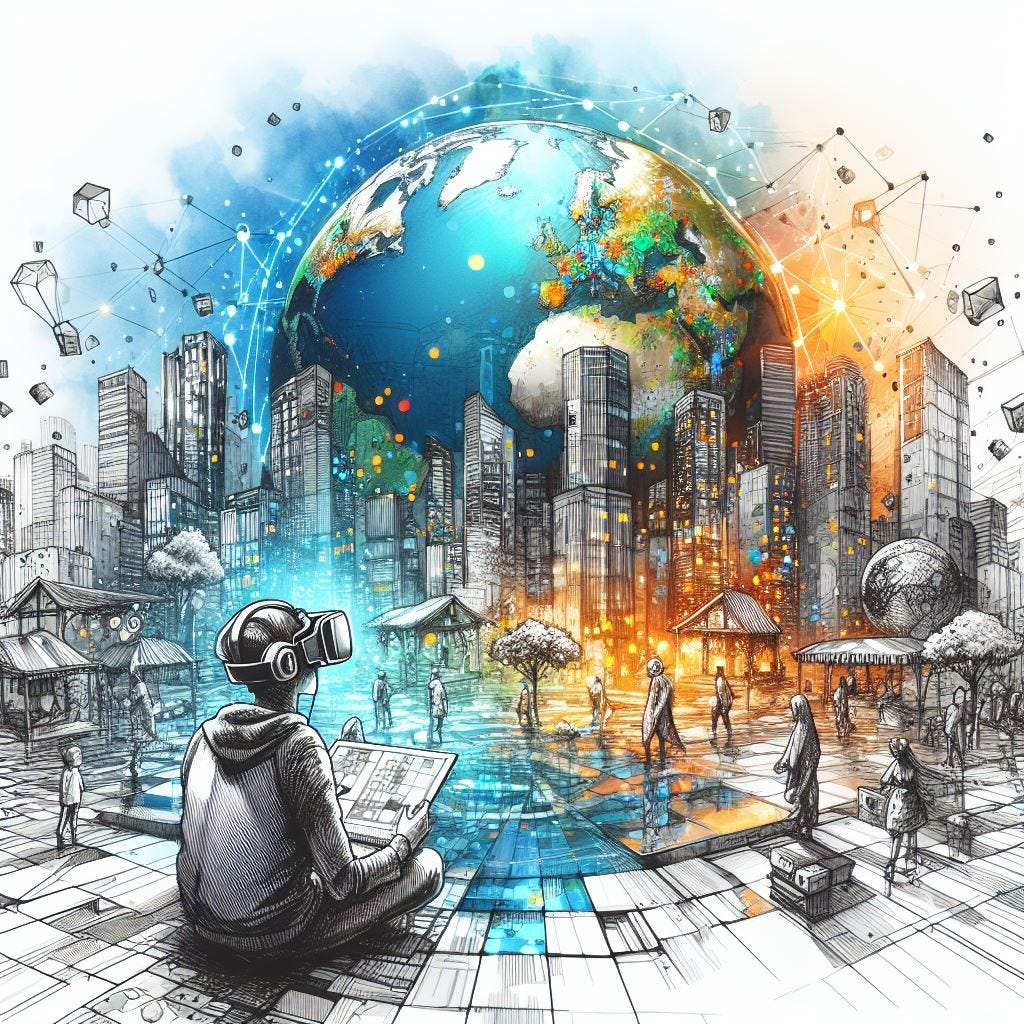
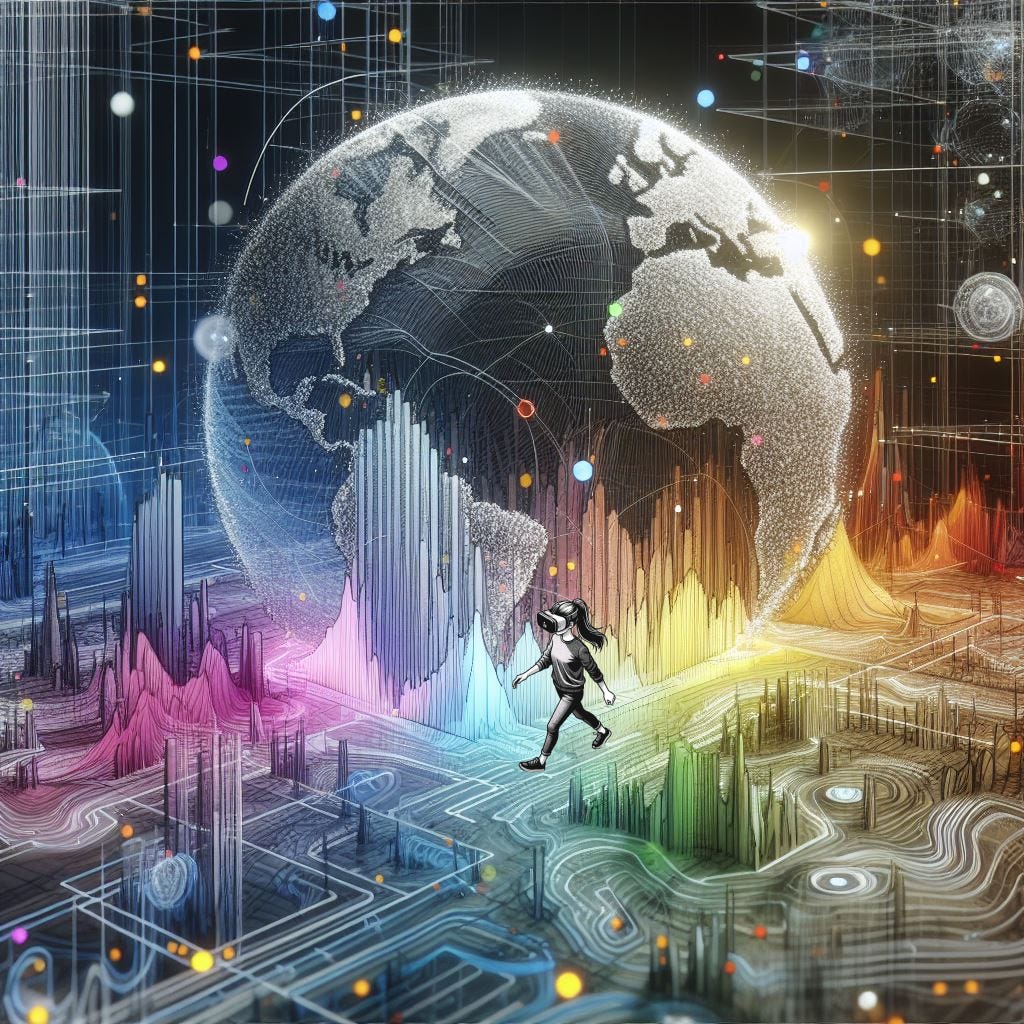
How can humans use Virtual Reality to understand data better?
Now, define the capabilities of the medium you are working with and what makes it special:
What makes VR special:
360° 3D Immersion
User has Social Presence in Space
Movement Tracking (Gestures and full body)
Eye Tracking
Of course, what makes computers special is also true for VR:
Interactivity
Simulation
Connectivity
Finally, for each human thinking mode described above, brainstorm how the capabilities of the medium can be used to solve the problem.
Here are my results of a quick brainstorm I did for this article:

Visual:
AI-Generated Data Dreamscapes Utilize AI to transform datasets into fully immersive environments, or "dreamscapes," where the landscape, flora, fauna, and weather conditions represent different data aspects. This leverages the human brain's innate pattern recognition in natural environments to intuitively understand complex data structures.
Aural
Represent a parameter as a melody or sounds (relates to the rest of the dataset through loudness and direction where the melody is coming from). Some patterns in the data set might be more easily discerned through changes in pitch, tempo, or volume.
Control data manipulation with speech commands.
Spatial
Immersive 3D Data Environments: VR can create fully immersive data environments where users can walk through and interact with data spatially. This could involve navigating a city map with real-time data overlays or exploring a 3D model of a molecule with data points representing different properties.
Set one parameter as “gravity” and see how it affects all other correlated parameters.
Intrapersonal
Add EEG sensors on VR headset and visualize own EEG data in real-time (might enable more powerful Neurofeedback sessions)
Virtual Data Diaries: Allow users to create and interact with virtual diaries or journals that track personal data, such as mood, health metrics, or productivity. This could help individuals see patterns in their own behavior and make more informed decisions based on their personal data.
Interpersonal
Social Data Exploration Games: Design multiplayer VR games where players collaborate or compete to solve data-related challenges, promoting teamwork, communication, and a shared understanding of data insights.
Tactile
Haptic Feedback Data Interaction: Utilize haptic feedback in VR controllers to allow users to "feel" data. For example, the resistance could increase as a user moves through denser data points, or vibrations could indicate crossing a threshold, making data exploration a tactile experience.
A haptic suit could provide an additional Input modality for a parameter. The user walks around in the dataset and the haptic suit applies various amounts of pressure depending on how the parameter relates to part of the data the user is spatially present.
Kinesthetic
Gesture-based Data Manipulation: Grabbing, stretching, or rotating multidimensional data structures to view them from different perspectives.
Movement tracking could track hip movements as an additional input modality. (In fact, researchers at the University College London were able to translate hip movements into a digital tail in VR. Participants could control the tail accurately and synchronously through hip movement7).
You see, with this method, I was able to easily brainstorm a bunch of interesting ideas in a systematic way.
Ideation becomes especially powerful if you stack ideas on top of each other:
What if you had a community of people that all wear VR headsets with EEG sensors? They meet in a digital environment where generative AI transforms the virtual environment in their vicinity based on their brainwave patterns, translating data points into shapes, colours, sounds, and textures.
For example, as the system detects increased alpha wave activity, the virtual environment responds by gradually transitioning the scenery. The sky, initially a soft dusk, brightens into a warm, soothing sunrise. The garden blooms with vibrant, softly glowing flowers. The more pronounced the alpha waves, the more vivid and lively the garden becomes, visually representing the depth of relaxation and focus.
When two people are spatially close in the virtual world, the algorithm generates distinct interesting patterns around them, based on whether their brainwaves are similar or different.
For example, as two people near, the ground between them starts to bloom with luminous, synchronized flower patterns that pulse gently in rhythm with their brainwaves. The colours of the flowers blend seamlessly from one user's aura to the other's, symbolizing cognitive harmony. The air around them sparkles with light particles that move in patterns mirroring the synchronized waveforms of their brain activity. A harmonious melody begins to play, with notes and rhythms that align perfectly with the visual display of their brainwave synchronization.
This example combines ideas for the visual, aural, spatial, intrapersonal, and interpersonal thinking modes of human beings.
What’s the use of this application? Maybe there is none (other than experiencing beauty, or maybe as a dating app?), but this is how we move towards innovation, by boldly exploring what’s possible.
This is how we can move beyond what’s already been done, to think outside of the box.
This is how we push the new mediums and technological wonders of the engineers to the highest level; to mend technology so that humans can use the full potential of their minds, instead of just a tiny part of it.
Referenced Literature
A lot of ideas and examples from this article are based on Bret Victor’s design principles. Check him out, his whole website is a treasure trove for innovation:
Bret Victor, beast of burden (worrydream.com)
Specific references:
Victor, B. (2014, October). Humane representation of thought: a trail map for the 21st century. In Proceedings of the companion publication of the 2014 ACM SIGPLAN conference on Systems, Programming, and Applications: Software for Humanity (pp. 5-5). https://vimeo.com/115154289
Davis, K., Christodoulou, J., Seider, S., & Gardner, H. E. (2011). The theory of multiple intelligences. Davis, K., Christodoulou, J., Seider, S., & Gardner, H.(2011). The theory of multiple intelligences. In RJ Sternberg & SB Kaufman (Eds.), Cambridge Handbook of Intelligence, 485-503.
Matsumoto, K. (2017). A review of Jerome Bruner’s educational theory.
Hagen, P. A. (2013). Listening to students: a study of elementary students' engagement in mathematics through the lens of imaginative education (Doctoral dissertation, University of British Columbia).
Anderson, P. S., Fast, K. (2020) Figure It Out: Getting From Information to Understanding. Rosenfeld Media. Figure It Out: Getting From Information to Understanding :: UXmatters
Victor, B. (2011). Scientific communication as sequential art. Online. http://worrydream.com/ScientificCommunicationAsSequentialArt
Steptoe, W., Steed, A., & Slater, M. (2013). Human tails: ownership and control of extended humanoid avatars. IEEE transactions on visualization and computer graphics, 19(4), 583-590. Human-Tails-Ownership-and-Control-of-Extended-Humanoid-Avatars.pdf (researchgate.net)